About ESTELA
STE/CSP Technology
Our Activities
STE News
EVENTS
Stay Connected
Get more STE/CSP news here!

Get more STE/CSP news here!
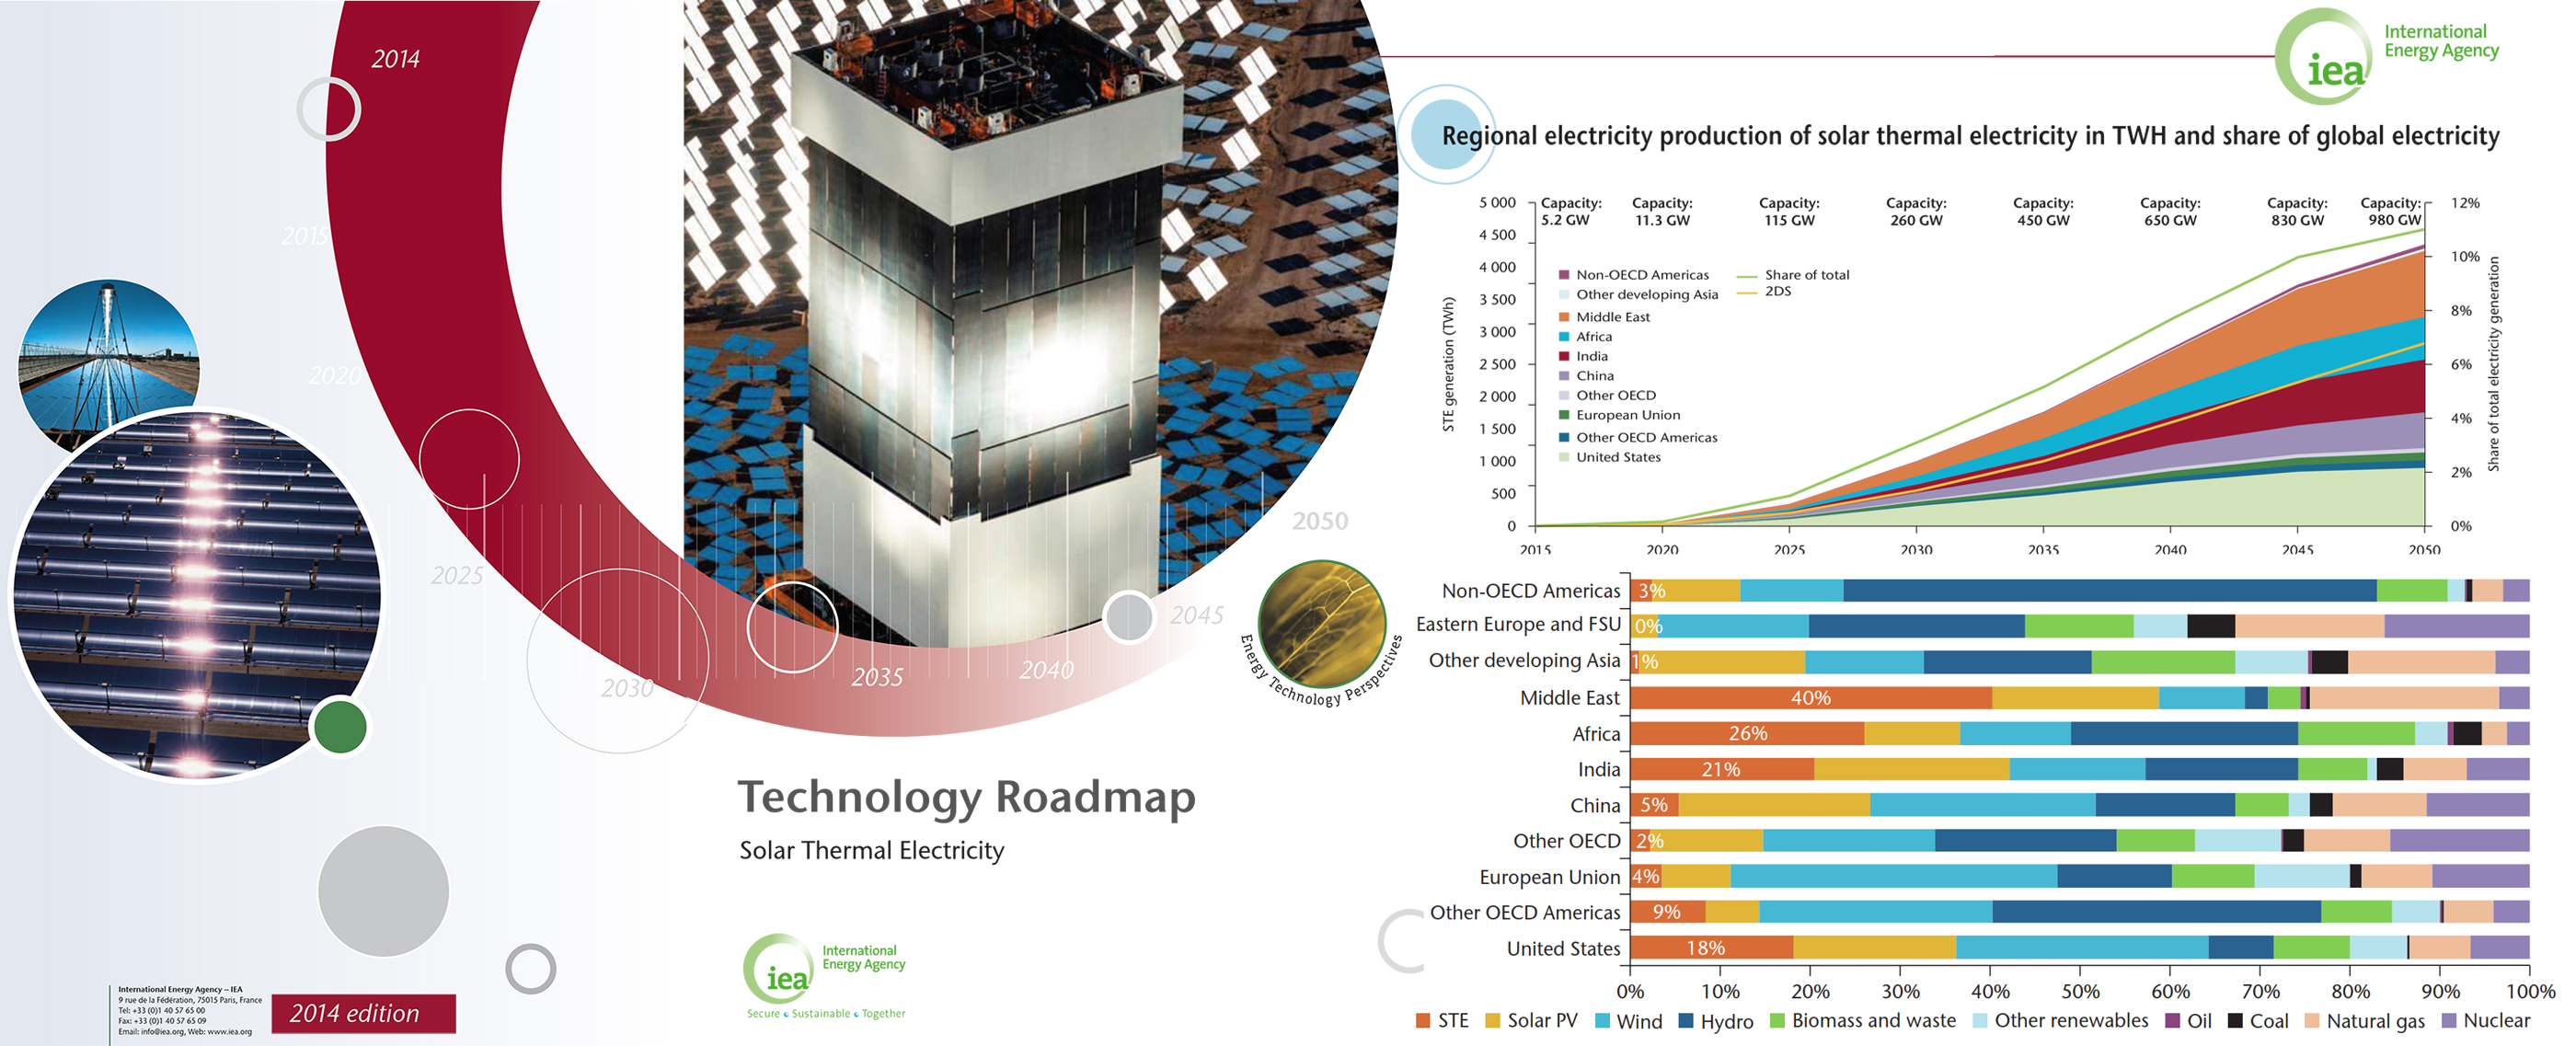
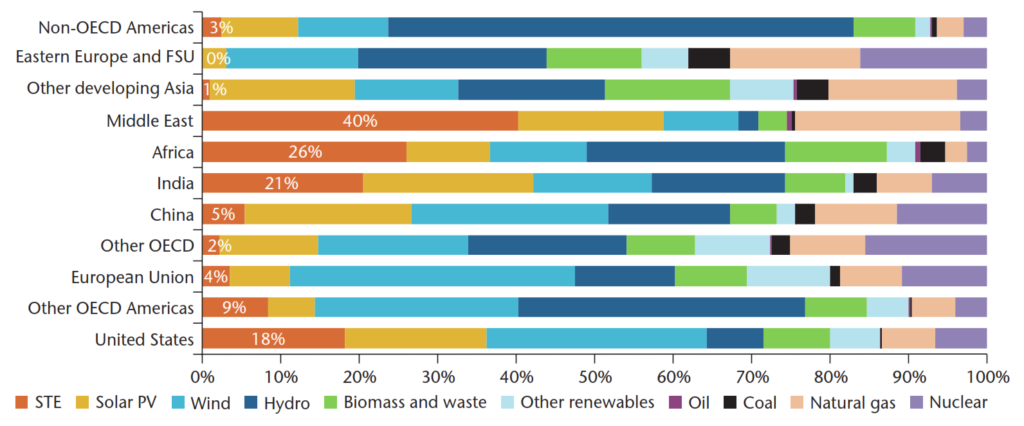
According to the IEA technology Roadmap 2014, STE will be the largest source of electricity in the Sunbelt countries, especially in the Middle East and in Africa. This roadmap forecasts a STE’s for global electricity production of 11% by 2050 – STE will reach 980 GW of global deployment by 2050, generating 4,380 TWh power worldwide.
It is estimated in the hi-Ren scenario that that would be 4% of STE installed capacity in Europe by 2050 (about 28 GW). To put it simply, we would need to triple the current deployment by 2030 and almost six times by 2050. Needless to say that in case of such a deployment, STE would become a fully mature technology with low costs, just like wind and PV.
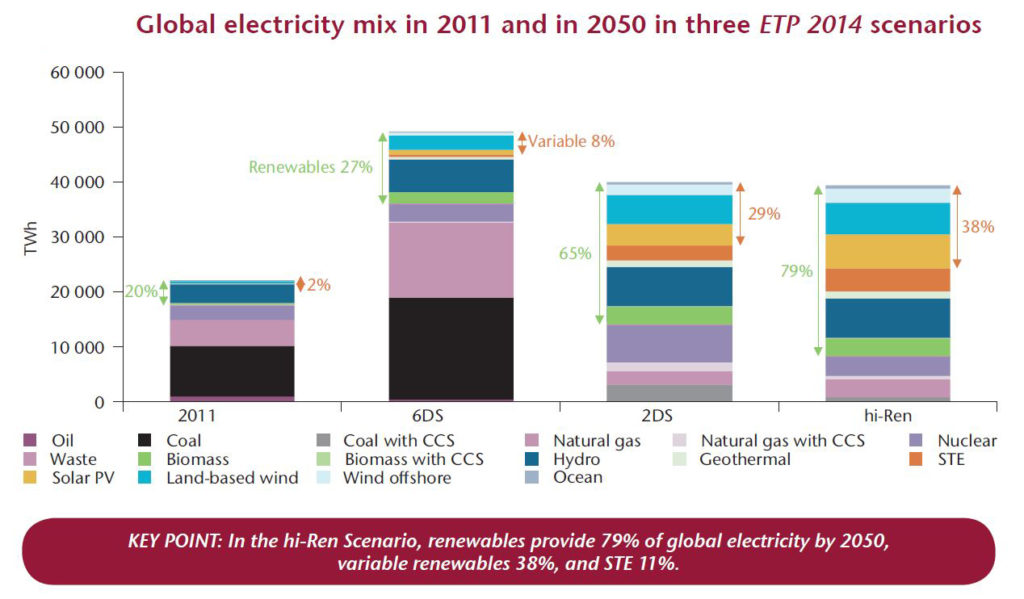
It is also estimated in this IEA report that combining STE and PV, solar electricity comes close to wind power, hydropower and nuclear, providing up to 27% of global electricity by 2050. In the hi-Ren scenario, solar electricity becomes the leading source of electricity globally from 2030 on.
“The value of STE will increase further as PV is deployed in large amounts, which shaves mid-day peaks and creating or beefing up evening and early morning peaks.” “From a system perspective, STE offers significant advantages over PV, mostly because of its built-in thermal storage capabilities. STE is firm and can be dispatched at the request of power grids operators, when demand peaks in the late afternoon, in the evening, or early morning, or when the sun isn’t shining,” commented the IEA report.
In order to unlock the true potential of all renewable energy resources, adding flexible RES technologies in the energy mix is a must.
STE is the largest source of electricity in Africa and the Middle East by 2050.
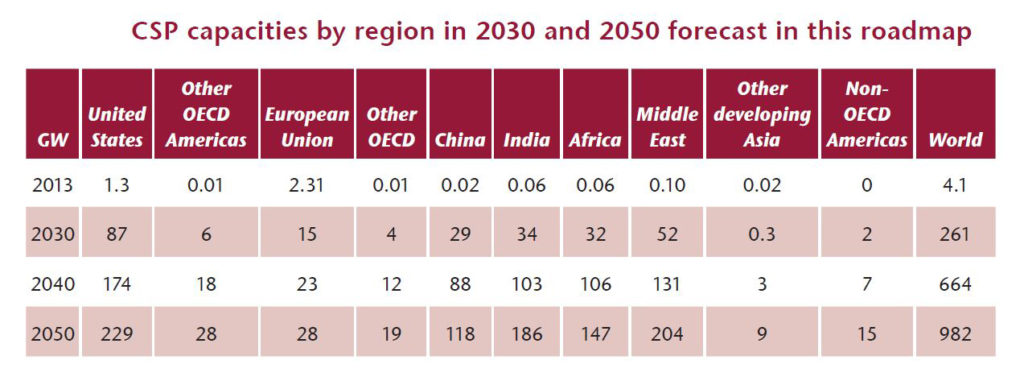
The path leading to the large CSP deployment envisioned in this roadmap dif fers significantly from the path in the original roadmap. In the most recent hi-Ren Scenario (IEA, 2014b), deployment is much slower until 2020, as technologies gradually mature and investment costs gradually fall. Global capacities jump to 260 GW by 2030. By 2050 they reach 980 GW.
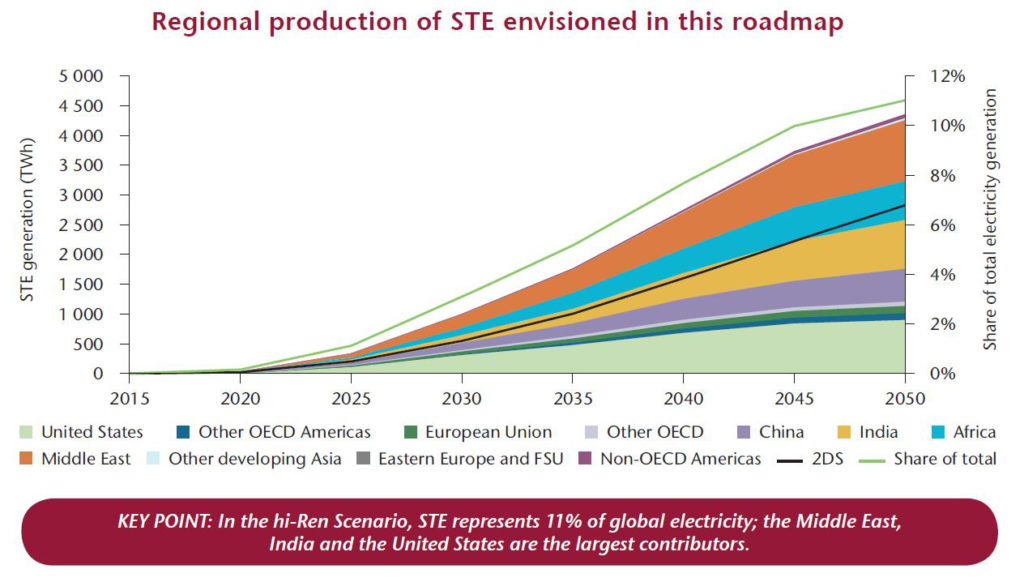
This represents capacity increases of 27 GW per year on average, with a five-year peak of 40 GW per year from 2040 to 2045. Table 3 shows the CSP capacities by region that this roadmap targets. Thermal storage is a key feature of CSP plants all along, and capacity factors grow regularly with increased solar field sizes and storage capacities, reaching on average 45% in 2030, a decade earlier than in the 2010 roadmap. This allows the amount of STE to reach about 1 000 T Wh by 2030, and 4 380 T Wh by 2050, thus providing 11% of the global electricity mix.
While CSP plants are limited in their possible extension in Europe, the United States becomes the largest contributor up to 2040, followed by the Middle East, India, China and Africa. By 2050, the Middle East overtakes the United States as the leading contributor, and India distances both Africa and China. The Middle East is also in first position when it comes to STE’s share of electricity generation in each region, followed by Africa, India and the United States.

In the last ten years, STE has expanded rapidly from a newly introduced technology to become a reliable, energy generation solution. However, by the end of 2016, only 5 GW of solar thermal electricity projects were operational worldwide. The projects under construction at the time of writing will add at least another 300 MW over the next two years. These projects are located mostly in South Africa, India, the Middle East and Morocco.
The potential for STE to meet global electricity demand is far greater. Our analysis based on the Advanced scenario assumptions shows that concentrating solar power could meet up to 12% of the world’s projected power needs in 2050.
Even under the Moderate scenario assumptions for future market development, the combined solar thermal power capacity worldwide would amount to approximately 20 GW by 2020 and 800 GW by 2050, with the deployment of 61 GW/yr. This would represent around 5% of global demand in 2050.
For this study, Greenpeace used a model to generate scenarios based on a Reference scenario or “business as usual” for world governments, as well as Moderate and Advanced scenarios based on realistic policies to support development of this clean, renewable technology. Under the Moderate scenario, the countries with the most sun resources, together, could:
[1] About US$ 18.4 billion in 2020 eExchange rate € 1 = US$ 1.15).
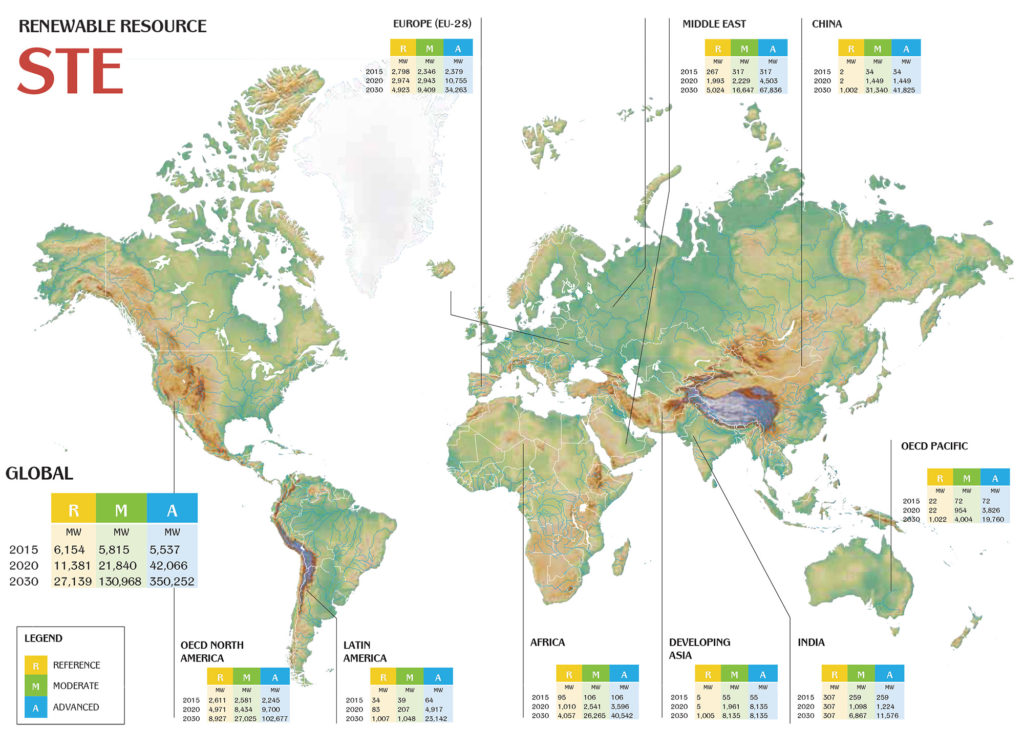
The Global Solar Thermal Electricity Outlook scenarios shows the range of possible outcomes depending on the choices we make now for managing demand and encouraging growth of the STE market. In the next five years, we could see as little as 941 MW of STE installed each year under the Reference scenario, to as much as 11,950 MW annually under the Advanced scenario.
Even under the Moderate scenario of fully achievable measures, the world would have a combined STE capacity of over 22 GW by 2020 and 781 GW by 2050, with an annual deployment of up to 61 GW. This would generate 54 TWh in 2020, by 2050 this would increase to 2054 TWh or around 5% of global demand. This scenario would require over €16 billion in investment by 2020, increasing raising to €162 billion by 2050. In the Moderate scenario, 935,000 jobs would be created in 2050.
In the Moderate scenario, 32 million tonnes of CO2 emissions would be avoided annually in 2020, increasing to 1.2 billion tonnes in 2050. The CO2 savings under the moderate scenario would be comparable to 3.5% of today’s global CO2 emissions.
Under an Advanced scenario, with high levels of energy efficiency, STE could meet up to 12% of the world’s power needs in 2050.
The Reference scenario is derived from the IEA’s2014 World Energy Outlook. It starts off with an assumed annual new capacity additions of 1.5 GW of STE increasing to 3 GW/yr by 2020. Growth rates continue at around 10% per year until 2035, and then decrease to around 5% by 2040. After 2040, the scenario assumes no significant further growth of STE. As a result, the scenario foresees the following:
Under the Moderate scenario, growth rates are expected to be substantially higher than in the Reference scenario. The assumed cumulative annual growth rate starts at 26% for 2016, and increases to 28% by 2020. By 2030, the growth rate falls gradually to 17% until it reaches 8% in 2040 and 6% after 2050. As a result, the scenario foresees the following:
In terms of generated electricity, the Moderate scenario would mean over 344 TWh of electricity produced by STE in 2030. De- pending on demand side development, this would account for 1.1%-1.3% of global demand in 2030 and 5%-5.9% in 2050.
Under the Advanced scenario, the assumed growth rate starts at 29% in 2016. By 2030, it has decreased to around 20%, and decreases further to 10% per year by 2035.Thereafter, the annual growth rate levels out at around a 5%. As a result, the scenario foresees the following:
Under an Advanced scenario, with high shares of solar electricity from STE plants, 2.6 Gt of CO2 could be avoided by 2050, making a significant contribution to protect the world´s climate whilst providing a substantial share of electricity to the world’s power needs.